

There's been a subtle shift in the way Collingwood champion Scott Pendlebury is operating in season 2019.
Written off in some quarters last year as no longer being deserving of the A-grader tag, the Magpies' skipper is now playing as well as ever.
Pendlebury spearheaded Collingwood's impressive dispatching of Port Adelaide on Friday night with 36 disposals (14 contested), five clearances and a whopping 11 inside 50s.
It was more of the same in what's been an outstanding campaign, including winning the Anzac Day Medal a fortnight ago.
Coach Nathan Buckley told AFL.com.au in the pre-season that because of Dayne Beams's return and his embarrassment of midfield riches, he was set to use his onball stars differently.
"All of the midfielders these days need to have another spot on the ground they can go to, not just to fill a gap, but to have influence and bring value," Buckley said in mid-February.
"That's the challenge to the guys who want midfield time for us; that when they go to different roles, they're actually adding value above the guys that would be in those roles if they were there.
"Pendles is an inside player, but he's also a very smart player, so he could be on the fringe in front (of the ball), behind or even on the wing."
The numbers illustrate what Buckley settled on in regards to the five-times Copeland Trophy winner.
Pendlebury's average centre attendances are slightly higher than last season (19.9 to 19.2), but it's where he's winning his possessions that is most interesting.
PENDLEBURY'S DISPOSALS BY ZONE
YEAR | FORWARD 50 | ATTACKING MIDFIELD | DEFENSIVE MIDFIELD | DEFENSIVE 50 |
2015 | 13.4% | 29.3% | 43.1% | 14.2% |
2016 | 10% | 34.8% | 39.2% | 16% |
2017 | 9.6% | 37.1% | 41.6% | 11.8% |
2018 | 9.4% | 35.5% | 40.1% | 14.9% |
2019 | 4.9% | 40.4% | 41.4% | 13.3% |
The result is Pendlebury leading the AFL in kicks inside 50 (equal with Luke Shuey), inside 50 kicks retained, and inside 50 kicks marked (equal with Gary Ablett, Jared Polec, Toby McLean and Jack Newnes).
It's a significant rise for the 31-year-old, who was last so prolific in this area back in 2015 – and even then, not quite so prominent.
Pendlebury's silky foot skills are one of the greatest weapons in the Pies' arsenal, but is he the competition's best kick inside 50?
That's where it becomes more complicated.
North Melbourne's prized recruit Polec is, perhaps, not being recognised enough for the specific outside role he is performing at his third club.
He boasts the best retention and mark percentages from his kicks inside 50 out of the top-50 players in this category, while Ablett ranks third and second, respectively.
North recruit Jared Polec's impressive outside stats have been under-appreciated. Picture: AFL Photos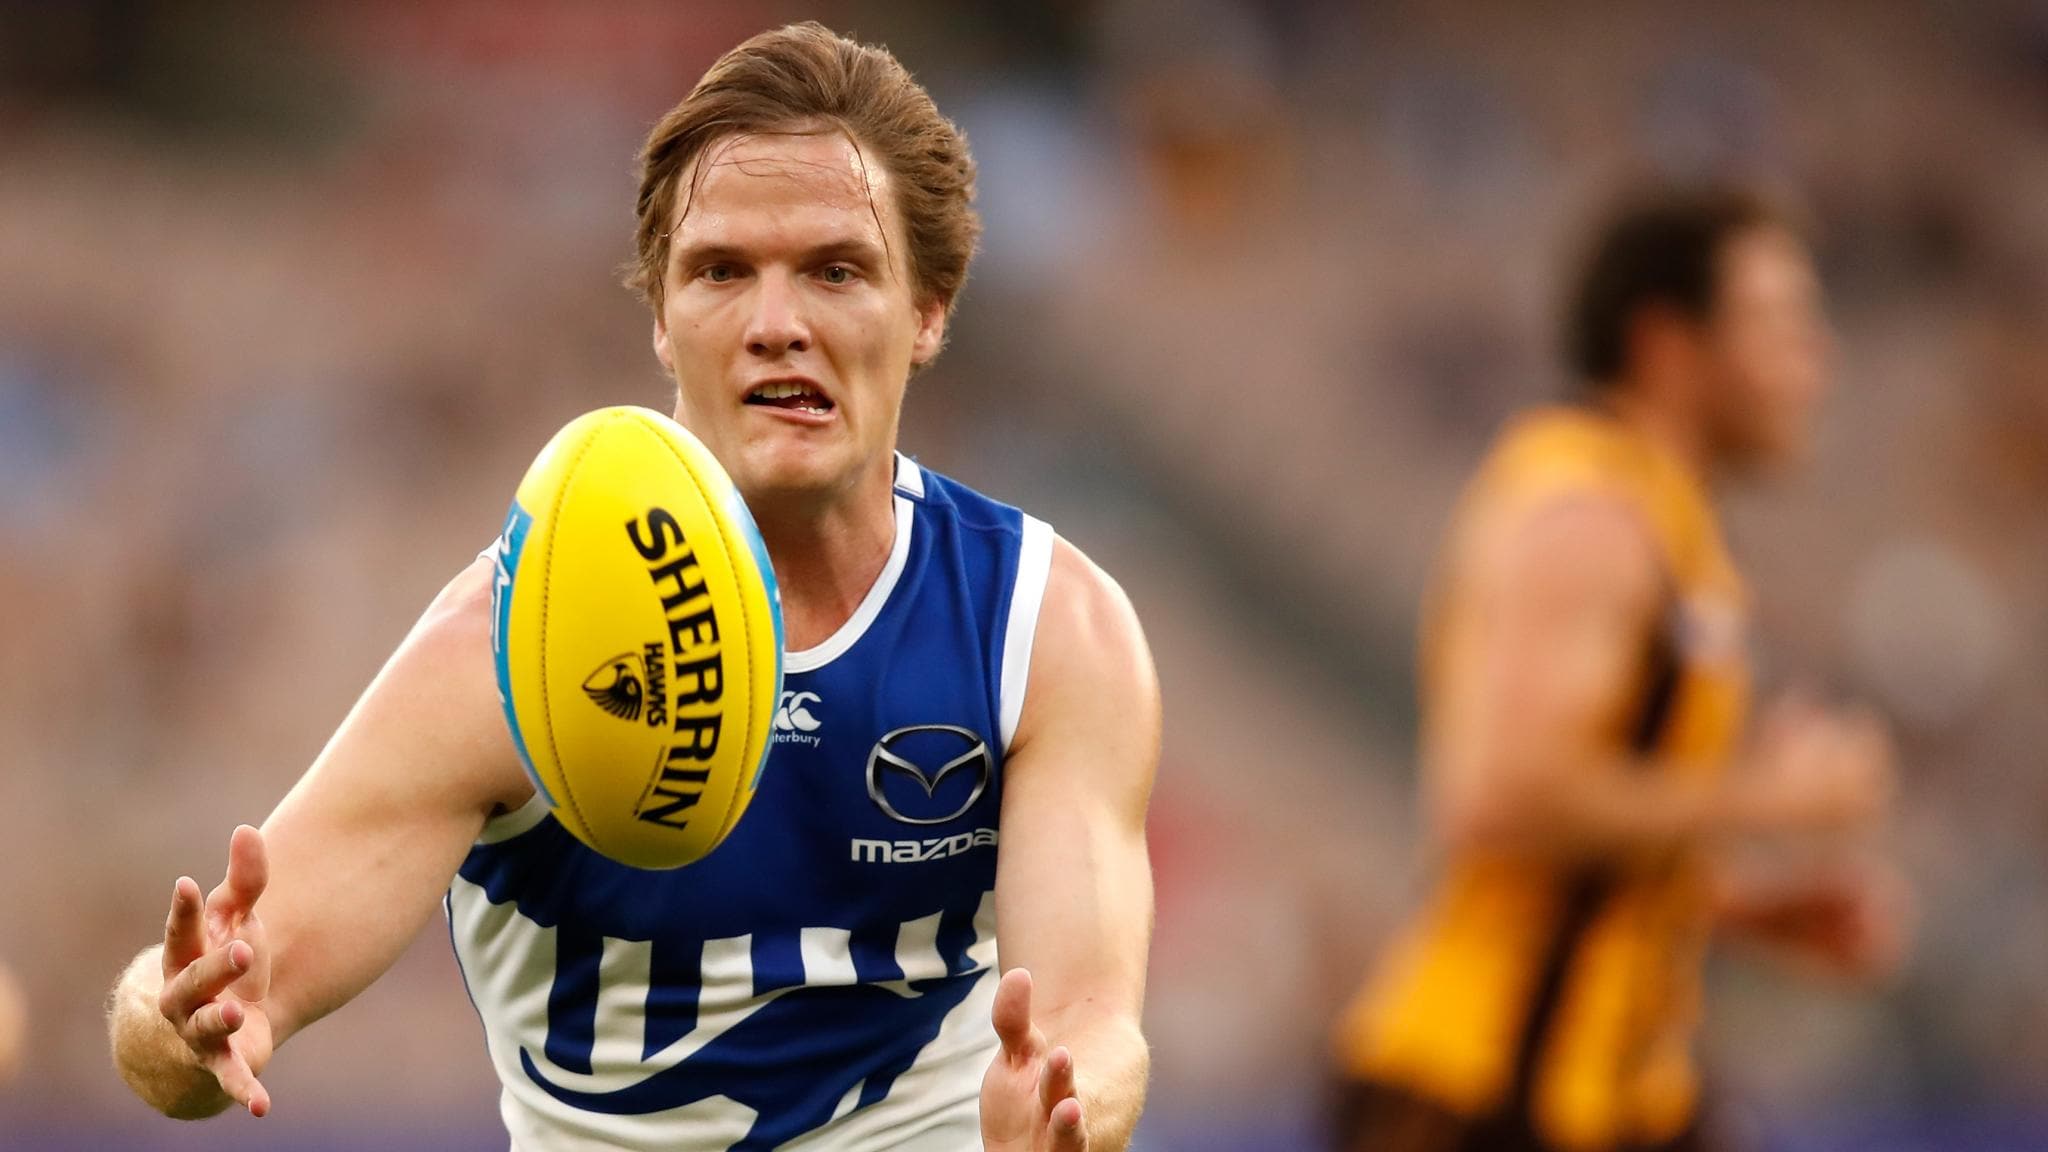
Pendlebury, for example, comes in at eighth for retention and 15th for marks, once percentages are factored in.
Another contender to the crown must be Brisbane star Dayne Zorko, who is fourth in retention percentage and No.2 behind 'Pendles' in total kicks retained this year.
Zorko was equal third in the latter statistic in the 2018 home and away season and placed first in total kicks inside 50 marked, after also being top 10 in both in 2016.
THE AFL'S BEST KICKS INSIDE 50
PLAYER | KICKS INSIDE 50 | RETENTION PERCENTAGE | MARK PERCENTAGE |
Scott Pendlebury | 39 | 59% | 23.1% |
Dayne Zorko | 35 | 62.2% | 21.6% |
Jack Newnes | 27 | 59.3% | 33.3% |
Dustin Martin | 27 | 59.3% | 22.2% |
Jarrod Berry | 27 | 55.6% | 25.9% |
Jacob Hopper | 26 | 57.7% | 30.8% |
Gary Ablett | 25 | 63% | 33.3% |
Brodie Smith | 25 | 56% | 32% |
Jack Gunston | 24 | 58.3% | 25% |
Jared Polec | 22 | 68% | 36% |
Doing it by hand
North Melbourne's handball happy ways this season have seen two of its inside midfielders climb into rare territory.
The Kangaroos have the AFL's lowest kick-to-handball ratio at 1.11, but Ben Cunnington and Jed Anderson are going well below that.
They are both at individual career-low kick-to-handball ratios that rank highly – or lowly, depending on how you gauge it – in the past decade.
MOST DISPOSALS WITH A K:H RATIO UNDER 0.5:1 (2010-2019)
PLAYER | MATCHES | SEASON | DISPOSALS | K:H RATIO |
Clayton Oliver (Melbourne) | 22 | 2017 | 30.0 | 0.37:1 |
Ben Cunnington (North Melbourne) | 7 | 2019 | 29.6 | 0.38:1 |
Patrick Cripps (Carlton) | 21 | 2016 | 27.0 | 0.45:1 |
Matt Priddis (West Coast) | 19 | 2010 | 25.7 | 0.45:1 |
Jed Anderson (North Melbourne) | 4 | 2019 | 23.0 | 0.48:1 |
Koby Stevens (Western Bulldogs) | 15 | 2017 | 21.7 | 0.48:1 |
Jaeger O'Meara (Hawthorn) | 6 | 2017 | 21.5 | 0.47:1 |
Touk Miller (Gold Coast) | 20 | 2017 | 20.9 | 0.48:1 |
Matt Thomas (Richmond) | 13 | 2014 | 20.5 | 0.44:1 |
Jordie McKenzie (Melbourne) | 15 | 2011 | 20.0 | 0.38:1 |
Rating the worst of the worst
Port Adelaide and Carlton were each effectively down for the count by quarter-time in their respective round seven clashes with Collingwood and North Melbourne.
So which team performed the poorer?
This is always subjective, especially when you factor in the quality of the opponent, but by Champion Data's mathematics it was clearly the Power.
Port Adelaide's first term against the Pies was statistically the second worst of the year. Picture: AFL Photos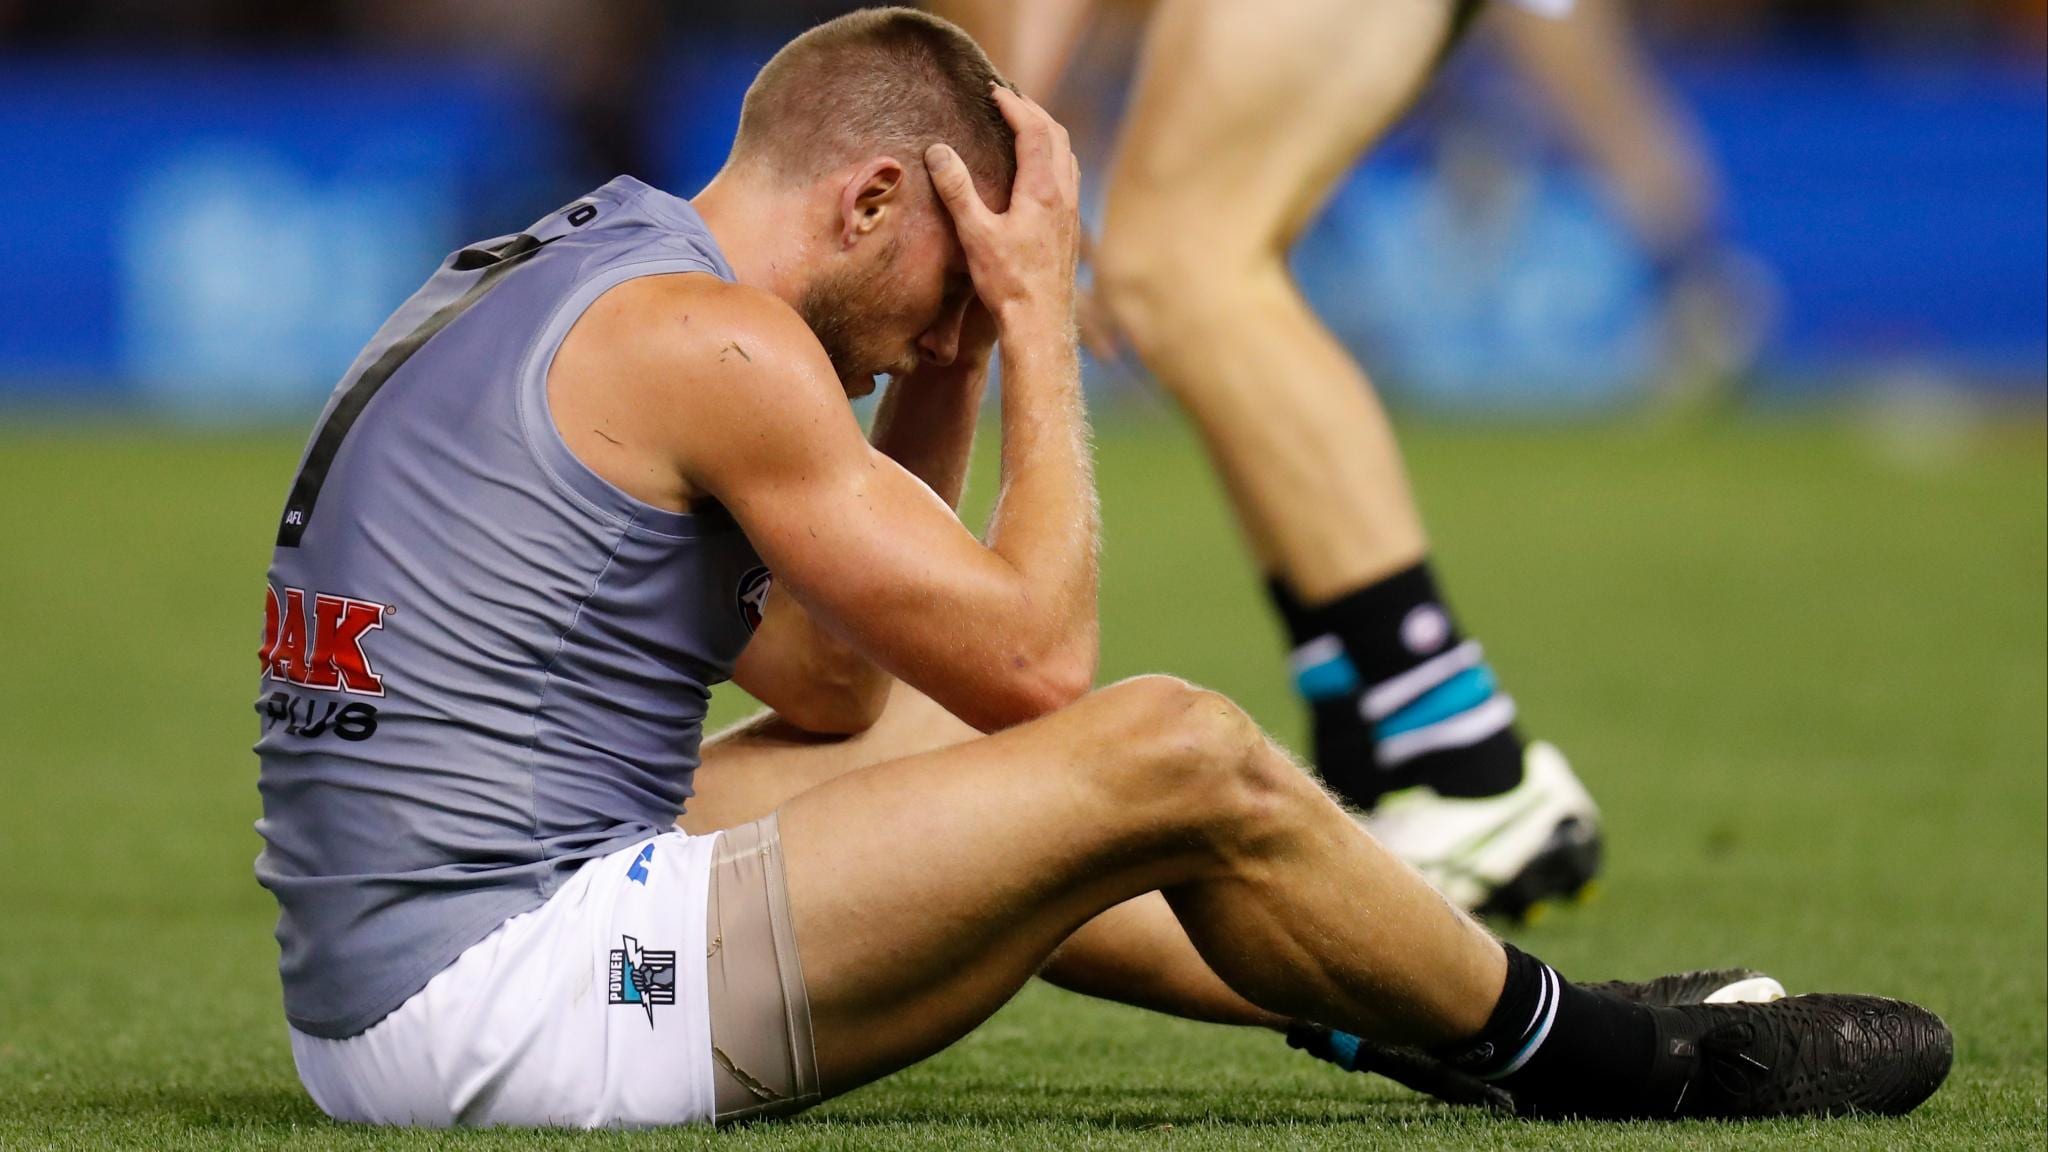
That is established from using the AFL's official number-cruncher's player ratings, and working out the sum of all players' rating points compared to their opposition.
If it makes supporters of both clubs feel any better, neither was the worst for a single term this season.
CLUB | OPPONENT | ROUND | QUARTER | DIFFERENTIAL |
Hawthorn | Western Bulldogs | Two | Fourth | -51.4 |
Port Adelaide | Collingwood | Seven | First | -50.2 |
Carlton | North Melbourne | Seven | First | -39.5 |
Brisbane | Collingwood | Five | Third | -38.3 |
West Coast | Geelong | Six | First | -38.1 |
Is 'the Richmond stat' dead?
AFL.com.au's Stats Files last year reported the Tigers' successful penchant for handball metres gained, and how it had become one of the keys to success.
Teams won 58 per cent of games in 2018 when they were in front in that statistic – a rise of 14 per cent from the previous season – but that figure is just 38 per cent this year.
That's the first time it is below 44 per cent in five seasons.
Two other stats that have decreased in importance from last year are hitouts to advantage from ball-ups (55 per cent to 45) and kick inside 50 retention percentage (68 per cent to 55).
It's all about quantity over quality in the latter category, with the side that retains the most total kicks inside 50 claiming 78 per cent of matches in 2019.
